Sunday, August 27, 2006

Virtual tables

In version 1.0 RC1 I used a feature of the SWT library, the virtual tables (SWT.VIRTUAL), in the matrix viewer.
This feature allows to show in the matrix viewer a matrix of thousand of rows and columns with a very good performance.
The idea is simple: since a table shows only a few rows at a time, you don't need to load the whole matrix in the table in one shot; you need to load only the rows that are shown in that moment.

My plan is to use the same feature also in the presentation viewer in a future version of the system (1.0 RC2?).

In this entry, I wanted to explain how I used the virtual tables in the matrix viewer.
For the implementation you can look in the CVS tree for the classes:

  • matrex.gui.viewer.matrix.MatrixViewer, the viewer

  • matrex.gui.viewer.matrix.MatrixViewerCache the cache for the viewer, containing the current version of the matrix (in other words, the viewer's model)


I based my code on the article SWT - Virtual Tables Tutorial.
As in the tutorial, I use the SWT.SetData event to fill the rows of the table. When the table shows a new row, it triggers a SWT.SetData event; in this event the code fills the row with data.
Differently from the tutorial, the matrix showed in the table can change its content at any time, and when this happens the table content must be updated.

Each time the matrix is updated, the code checks how big is the change, examining a small sample of items of the matrix:

  1. if only a small amount of items of the matrix is changed, only those items in the viewer need to be changed.

    Doing some test I discovered that extracting a row that the table did not show, using the statement table.getItem, the row is not null but each of its item is empty and the table does not try to populate it triggering a SWT.SetData event.
    Therefore it does not make sense to update a row that was not shown before.

    So, the viewer cache keeps an array that tells for each row if the row was shown before (for which an SWT.SetData event has been triggered).
    When an item of a row needs to be updated:


    • If the row was shown before it is updated immediately using the table.getItem.setText statement.

    • Otherwise nothing is done: if the table later shows the row, it triggers the SWT.SetData event for that row, which reads its current, updated content from the cache.


  2. Otherwise the table is cleared and filled up again with the new matrix; as we saw in this case the performances are good because the only rows that are loaded are the ones that are shown.
    To clear the table I used the following statements:

    table.clearAll();
    table.redraw();
    table.setItemCount([number of rows of the matrix]);

    The last statement triggers the SWT.SetData events for the shown rows.


I tested this solution with small and big matrices, small and big changes and it seems to work correctly and with good performances.
The Matrex API

From version RC1, the Matrex executable code is divided in 3 jar files:

  • matrex_api.jar containing the Matrex underlying structure, engine and file system interaction

  • matrex_fun.jar containing the java executable code for the function templates

  • matrex_gui.jar containing the code for the GUI


matrex_fun.jar was already there in version M2 (it was called function.jar), matrex_api.jar and matrex_gui.jar was merged in a single jar file, matrex.jar.

So what's the big deal?

Now you can use matrex_api.jar (probably together with matrex_fun.jar) as library in your own application.

For example if you have an application that needs to calculate a special function you can:

  1. start Matrex and build a project that calculates the function (with several matrix and function items)

  2. Let the application use that project (through matrex_api.jar and matrex_fun.jar) to calculate the function


In the future I will produce:

  • Javadoc documentation of matrex_api.jar

  • a guide for building an application that uses it

Matrix editor: custom headers

Often in a spreadsheet you need to work in the same time with two (or more) vectors that are connected by a key-value relationship.
For example:

  • days in a period and the quantity of rain in these days

  • categories of people with the average books they read in a year

  • cities with their population amount

  • bank accounts and the amount of money in them


In a spreadsheet you normally write them as two consecutive columns or rows.
In this way you can use the static vector (days, categories, cities, bank accounts) as ruler for the value vector (rain, books, population, money).

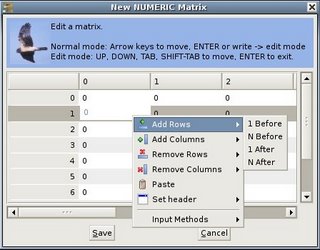
In Matrex that was not possible before version RC1. Matrex uses a "spreadsheet" concept only in the data presentation; to edit the vectors/matrices, it uses a matrix editor:


The editor can only edit one single vector/matrix, not two in the same time.

In version RC1 I solved the problem using customized headers.

In the editor popup menu, I added the Set header menu. It has the sub-menus:

  • Set vertical header

  • Set horizontal header


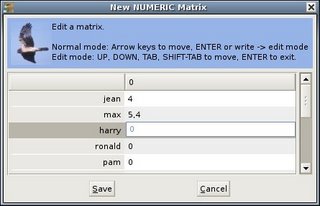
With the first sub-menu (vertical) you select a matrix int the project. The first, static, gray column will show the content of the first column of the selected matrix:


The second sub-menu (horizontal) you change the content of the first, static, gray row so that it shows the content of the first row of another matrix selected in the project.

In this way you can use the header data as ruler to write the content of the edited matrix.

Navigation

Matrex RC1 has a new feature, named navigation.


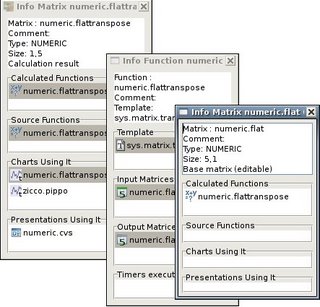
Navigation is based on the info window, which appear clicking on the info menu (Ctrl-I) on a tree item (matrix, function, chart ...).

The info windows are not new: they show some textual information about the item and the lists of items to which it is connected.
For example, the info window related to a matrix shows the function that calculates the matrix, the functions calculated with that matrix, the chart showing that matrix and the presentations containing that matrix.

What is new is that the each connected item displayed in the info window has a popup menu (view, edit, info).
Using the info menu you can navigate the connections of the project items: for example you can open the info window of a function, from it open the info window of one of the matrices that it calculates, from it open the info window of a chart that shows that matrix.

In this way you can, for example, know which items in the project change if you change the content of a matrix.

It is a powerful feature to understand the structure of a project.

The Matrex idea

I'm working with Excel in my job.
Generally we use Excel to calculate formulas on data extracted from a database and present everything as sheets and charts.
This is how we do it:
- write the SQL query
- get the result set in a sheet
- write the formulas for the cells of the result set's first row
- copy the formulas for all the other rows of the result set

It is easy to copy formulas from one cell to the other in Excel, but why we need to do it at all?
It would not be easier to get the result set as one vector for each column, and calculate the formulas on this vectors, not on sheet cells?

So I wrote Matrex.


Matrex is equivalent to a spreadsheet, but works with vectors, not cells.

So, to do the same in Matrex, we need to:
- write a function that produces vector/columns from an SQL query
- apply the functions/formulas on the resulting vectors (only once).

Working with Matrex you have also these advantages:
- you can name vectors/matrices and functions (formulas)
- multithreading
- in the future, client/server and distributed calculation